Based on the diagram, this experiment includes a single continuous outcome measure and at least five factors of interest which are all categorical, one is also a repeated factor. The levels of the repeated factor are not randomised, unlike the levels of the other factors of interest and this has implications on the choice of statistical analysis. The analysis also includes at least four covariates and at least five blocking factors.
If this description is not accurate, please check your diagram and verify that all nodes are connected properly, all variable categories are indicated and tagged to the relevant interventions or measurements and the information provided in the properties of each node is accurate; then critique it again.
The number of factors of interest is very high. With five factors, a full factorial design would need at least 32 groups (5 factors with at least 2 categories each: 25) and it seems unlikely that the experiment will be large enough (in terms of numbers of animals) to estimate all the interactions reliably. For example, with five factors, there are ten possible two-way interactions. In practice three-way (and above) interactions are unlikely to occur and you should consider reducing the number of factors of interest. Alternatively you could manually amend the statistical model to reduce the number of higher-order interactions included in the model; in this case the best course of action would be to consult a statistician.
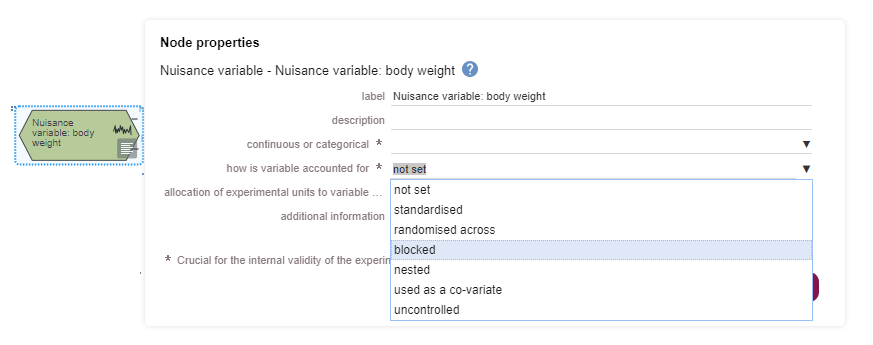
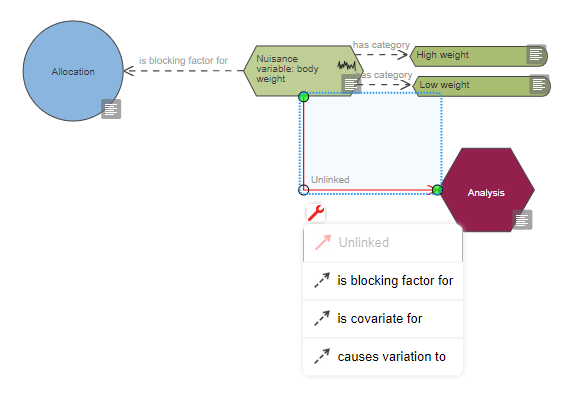
The number of blocking factors is also very high. The decision to include blocking factors in the randomisation and the analysis depends on previous experience and/or literature evidence that nuisance variables (e.g. practical constraints on the experiment) may influence the outcome and potentially increase the variability. Blocking involves dividing the experiment into a series of mini-experiments; each mini-experiment should ideally contain all the treatments but have fewer animals per treatment group than the full design. If all treatments are present in each of the mini-experiments, then five blocking factors imply dividing the experiment into a minimum of 32 mini-experiments (5 factors with at least 2 categories each: 25) and it seems unlikely to run an experiment with such a large number of animals. The best course of action would be to consult a statistician to estimate the effect of these blocking factors, and screen them to only include those that are influential.
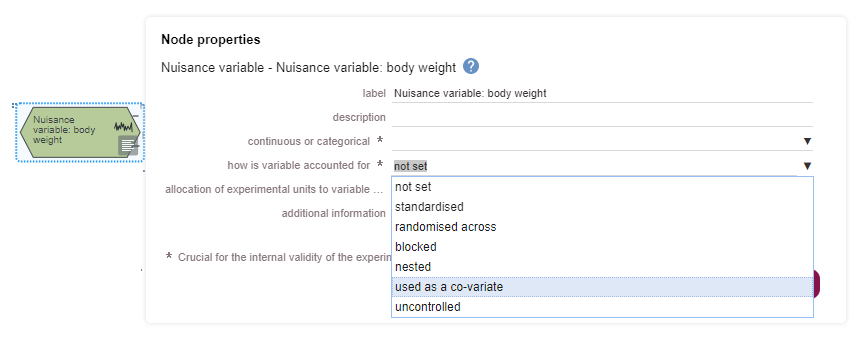
The number of covariates is also very high. Although you may decide to measure all of these covariates during the experiment, the decision to include each covariate in the statistical analysis depends on each covariate explaining some of the unaccounted for variability and meeting the assumptions outlined below. It seems unlikely that all covariates you have selected will each explain a separate amount of the unaccounted for variability – it is likely that at least two covariates will be correlated and hence explain the same source of variability. If this is the case, then only one of the pair of covariates needs to be included in the statistical model. More information on when it is appropriate to include a covariate can be found on the independent variables page of the EDA website.
Statistical analysis methods compatible with this design include two-way, three-way or four-way repeated measures mixed model with blocking factor(s), depending on the total number of factors of interest. This test assumes that the data satisfies these assumptions: residuals are normally distributed, homogeneity of variance and the outcome is measured on a continuous scale (read more about parametric and non-parametric tests).
Alternatively, a repeated measures factorial ANCOVA with blocking factor(s) could be used but note that the mixed model approach includes two benefits over the ANCOVA approach:
- If a data point is missing for an animal the rest of the data from that animal can still be used.
- The mixed model approach can be applied when the assumption of sphericity does not hold (condition where the variances of the estimates of the differences between all possible pairs of groups are equal).
Note that the data cannot be analysed using a standard factorial ANCOVA — a repeated measure approach should be applied because the levels of the repeated factor are not randomised within each animal and the independence of the errors assumption will probably not hold. It is also important to consider if the covariate should be used in your analysis.
A covariate should be used if:
- The covariate is independent of the treatment.
- There is a strong relationship between the covariate and the outcome measure (i.e. either they both increase together or one increases while the other decreases).
- The relationship between the outcome measure and the covariate is similar for all treatments (i.e. there is no significant treatment by covariate interaction).
The above assumptions can be tested by plotting your data, details of what to look for and example graphs can be found on the independent variables page of the EDA website. If there are multiple covariates you are considering including in your analysis, ensure that the assumptions hold for each of them.
In many cases you will not know if including a particular covariate in your analysis is appropriate when planning your experiment. You should measure the covariate during your study, but only include it in your statistical analysis if the assumptions for covariate inclusion are met.
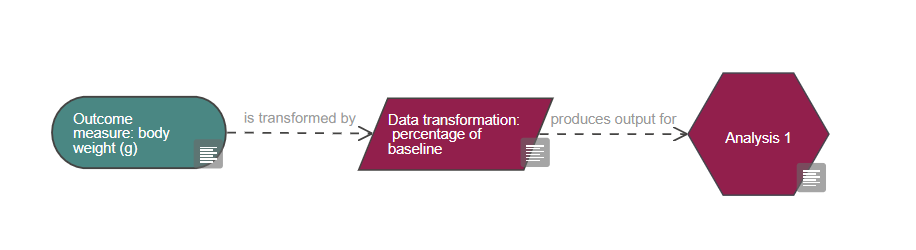
If you have reasons to think the data are not normally distributed, and/or the variability of the responses is related to their numeric size, you should first consider transforming the data to normalise it (read more about data transformation) and assess if the transformed data satisfies the parametric assumptions. Most data can be normalised using transformations such as log or square root and using parametric tests is preferable as they have more statistical power than non-parametric tests, as long as the parametric assumptions are met.
When normality assumptions do not hold, even after a mathematical data transformation, a rank transformation can be applied to the data and parametric tests (in this case a repeated measures factorial ANCOVA with blocking factor(s)) can be performed on the ranked data. Note that there are assumptions associated with non-parametric tests also. For example, to perform a rank transformation the data must be able to be ranked, with only a few ties (e.g. identical values that will end up with the same rank), the observations must be independent and the covariate must have a linear relationship with the rank. Another option is categorical data analysis (e.g. categorising data as ordinal or binary outcomes and using generalized estimating equations or a generalized linear mixed effects model for the analysis). Your local statistician can help advise on this. These approaches will lead to a loss in power due to the categorisation of continuous data.
Interpreting a factorial ANOVA
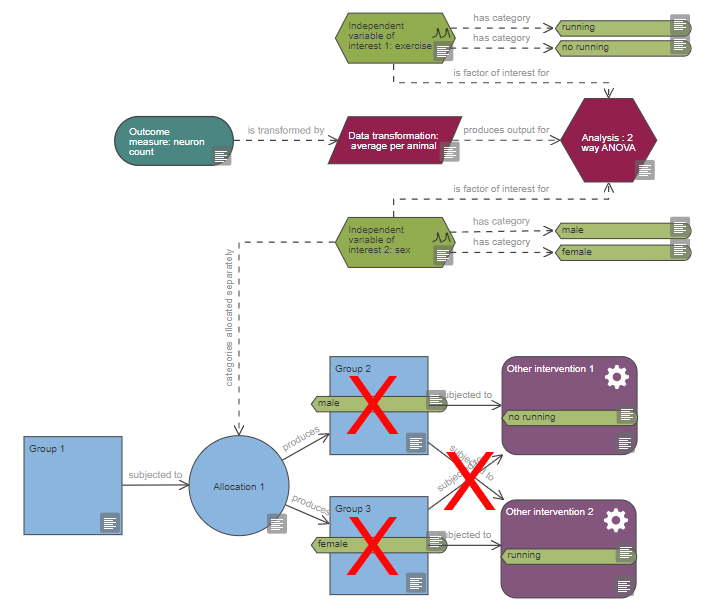
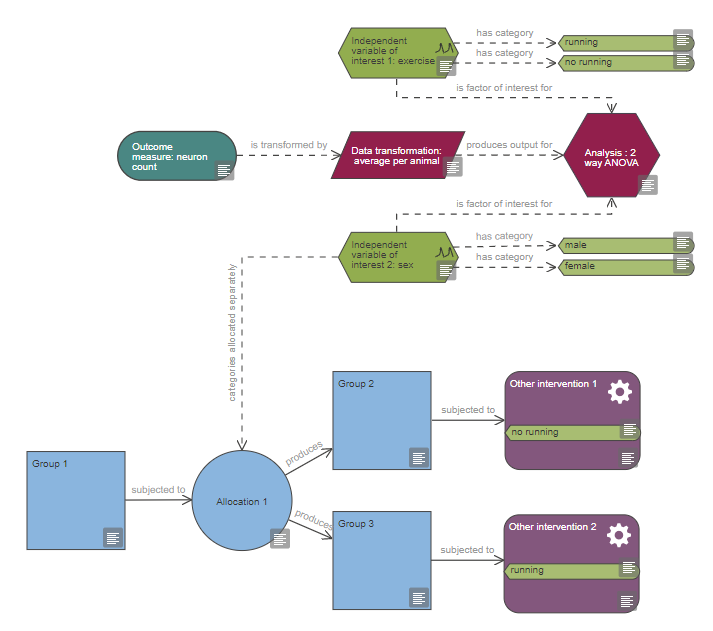
There is a common mistake when interpreting the results of a factorial ANCOVA. For example, a study of the effect of exercise on performance of a behavioural task is investigated in animals of both sexes with baseline locomotor activity as a covariate. A claim that the overall effect of exercise is different in males and females can only be supported by the finding that the interaction between the two factors is statistically significant (i.e. the size of the effect is different in males and females). A significant effect of exercise in one sex but not the other is not appropriate to support the claim that there is a difference between sexes.
Analysis software
Software such as InVivoStat can be used to run a factorial repeated measures mixed model with blocking factor(s), and apply data transformations. The test can be found in the following menus:
Statistics>Repeated Measures Parametric Analysis
References and further reading
Nieuwenhuis, S, Forstmann, BU and Wagenmakers, EJ (2011). Erroneous analyses of interactions in neuroscience: a problem of significance. Nat Neurosci 14(9):1105-7. doi: 10.1038/nn.2886
https://www.graphpad.com/guides/prism/latest/statistics/how_to_think_about_results_from_two-way_anova.htm