Including this independent variable of interest in the analysis will require an increased number of animals
You have connected your independent variable of interest to your allocation node and to an analysis node. This suggests that you want the categories of this independent variable of interest distributed evenly between the groups shown on your diagram. This is only appropriate for variables defining an animal characteristic (e.g. strain or sex). By including it as a factor in the analysis, you also want to investigate whether the effect of the intervention depends on that animal characteristic.
If this independent variable is not an animal characteristic, disconnect it from the allocation node, and ensure that all experimental groups resulting from the allocation are represented explicitly on your diagram. You should then disregard the rest of this prompt and critique your diagram again to get updated feedback.
Implications for the sample size calculation
For the purposes of your sample size calculation, you need to consider that there are more groups in your experiment than those shown on your diagram. For example, if the independent variable of interest is sex, with two categories: male and female, the actual number of groups in the experiment is twice the number of groups on the diagram because each group node on the diagram represents a group of males and a group of females.
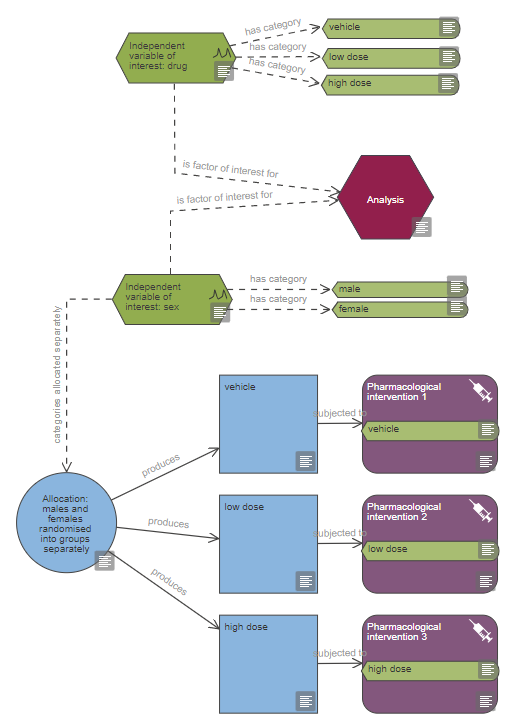
The example below is an experiment testing the effect of two doses of a drug. There are three groups (vehicle, low dose and high dose) and the independent variable of interest that is being randomised to these groups separately is sex and has two categories (male and female. This means that you essentially have six groups in the experiment (vehicle males, vehicle females, low dose males, low dose females, high dose males, high dose females) but only three are represented on the diagram for simplicity.
When calculating the sample size for the example shown above, the resulting n per group is for each of the six groups (e.g. the three female groups and the three male groups in your experiment). The power calculator in the EDA does not automatically take this into account. Therefore on your diagram, in the properties of the group node, the ‘planned number of experimental units’ field the number should be doubled as the groups on your diagrams represent male and female groups combined.
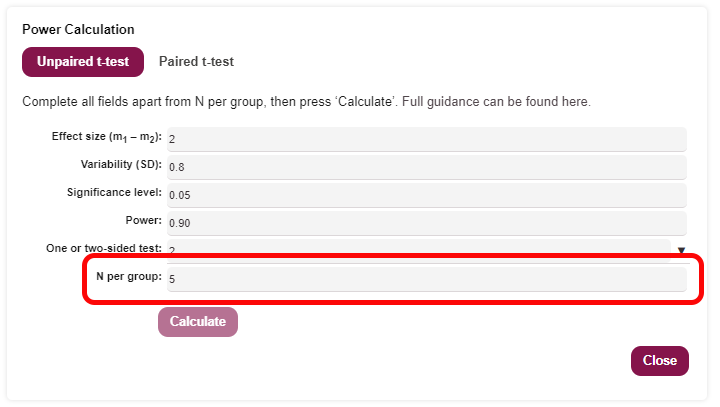
In the image of the power calculator below the n per group calculated is 5 (outlined in red in the image below).
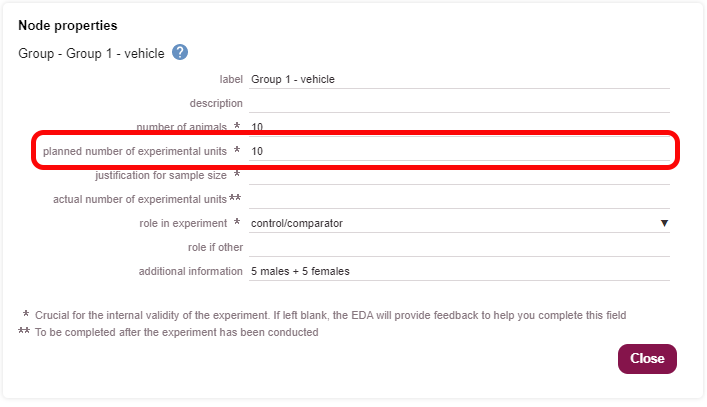
In the group node properties the ‘planned number of experimental units’ (outlined in red in the image below) should be double the n per group calculated as each group node represents the male and female groups combined. You can use the ‘additional information’ field to clarify that the group is half male and half female.
The same principle applies to other animal characteristics, for example if you are testing three different strains, each group on the diagram represents three different single-strain groups and the n per group will need to be multiplied by three. If you are testing an animal characteristic with x different categories (e.g. each category being a different genotype), the n per group from your power calculation should be multiplied by x (the number of different genotypes) when entered into the group node properties.
If the sample size for your experiment means the experiment has to be performed in batches it is important that each batch has all experimental groups in it. In this case you would treat the batch as a blocking factor in both the randomisation and the analysis to take account of any variability introduced by the different times the batches were run.
Is using this animal characteristic as a factor of interest the most appropriate choice for your experiment?
This approach will enable you to investigate whether the effect of the experimental intervention depends on this animal characteristic and to test the effect of the intervention in, for example, males and females separately, and compare the responses between sexes.
However, if the purpose of your experiment is to determine the overall effect of an intervention, and the animal characteristic is not of direct interest, it might be appropriate to use the animal characteristic as a blocking factor (i.e. a nuisance variable), which would enable you to reduce the overall number of animals in your experiment.
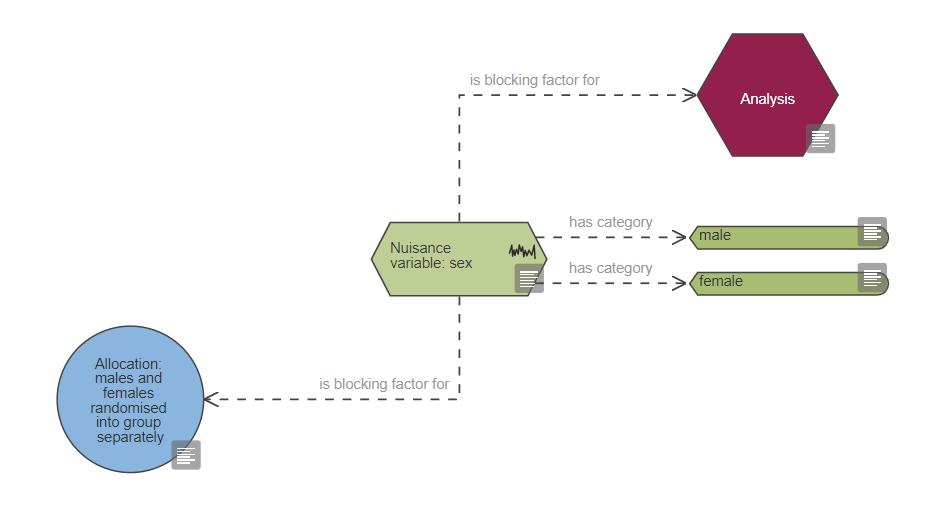
To do this, delete the independent variable of interest node and add a nuisance variable node, connect the nuisance variable node to the variable category nodes (i.e. the variable category nodes that were connected to the independent variable of interest node, e.g. male and female). The nuisance variable node should be connected to both the allocation and the analysis nodes with the link ‘is blocking factor for’ as shown in the image below.
If you modify the diagram, please critique it again.