Example 1
Effect of drug A on plasma glucose level
View experiment diagram | Use this diagram as a template
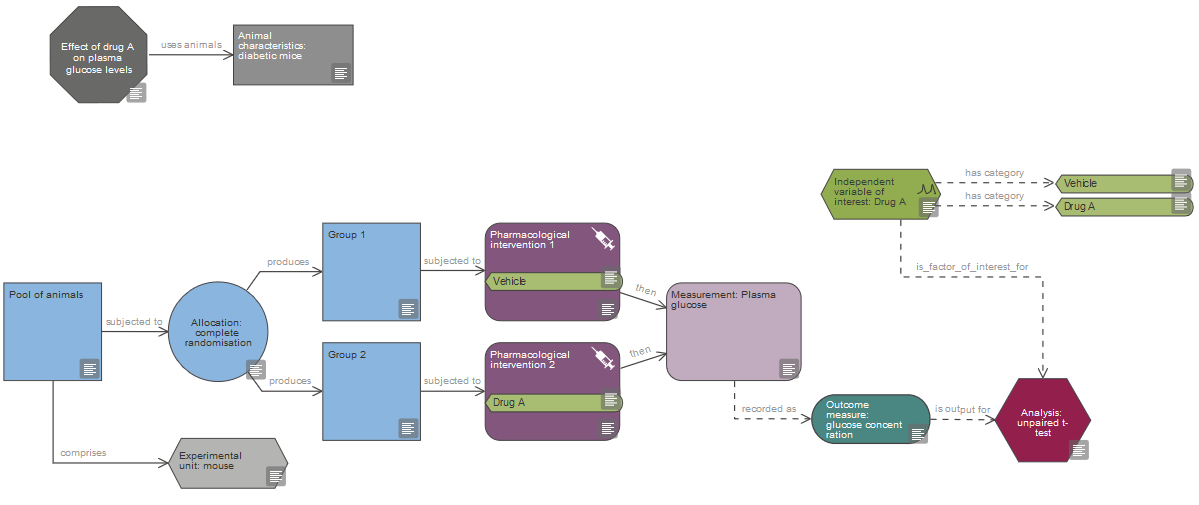
An experiment is conducted to test the hypothesis that drug A has an effect on plasma glucose level in diabetic mice. To test this hypothesis, mice are randomised into two treatment groups. Group 1 is the control group; mice in this group receive the vehicle for drug A (a saline injection). Group 2 is the test group, mice in this group receive drug A (10 mg/kg). The experimental unit is the individual animal as each mouse can be allocated to a particular treatment group independently of other mice. Syringes are prepared by a third party (based on the randomisation spreadsheet) and labelled for each individual animal so that the experimenter does not know whether they are injecting each mouse with drug or saline.
An hour later plasma glucose levels are measured, the outcome measure is the glucose concentration. The measurement is carried out blind as the allocation sequence has not been revealed to the experimenter.
In this experiment there is one independent variable of interest: Drug A, which has two categories: vehicle or drug. It is included as a factor of interest in the analysis. If the data fits parametric assumptions, it can be analysed with an unpaired t-test.
The analysis is also carried out blind, the data is organised by the third party the allocation sequence was originally sent to into ‘Group A’ or ‘Group B’, so that the person doing the analysis knows which animals are grouped together but not what treatment they animals received.
The sample size is determined using the sample size calculator for unpaired t-test provided in the EDA. In previous experiments under the same conditions but testing a different drug, plasma glucose levels of diabetic mice in control groups were around 280 ± 50 mg/dL (mean ± SD). It is estimated that a difference of 100 mg/dL between the two groups would be biologically significant and a significance level of 0.05 with an 85% power are considered appropriate for this experiment. Data is entered as follows in the calculator:
- Effect size (m1-m2): 100
- Variability (SD): 50
- Significance level: 0.05
- Power: 0.85
The field “N per group":” is left blank and the calculator returns n=6. Thus 6 animals per group are needed to test the hypothesis with sufficient power. The randomisation is done using the EDA spreadsheet, which allocates twelve mice into two groups of six.
Keywords
Two-group comparison | Animal as experimental unit | Complete randomisation
References
This experiment is loosely based on example 2.1 (Bate and Clark, 2014)
Bate, ST and Clark, RA (2014). The Design and Statistical Analysis of Animal Experiments. Cambridge University Press.