Getting the most out of the EDA
This guide is a suggested workflow to help you use the EDA effectively. It is not meant to be prescriptive as every experiment is different, but following this sequence of steps can help you to get the most from the support available in the EDA.
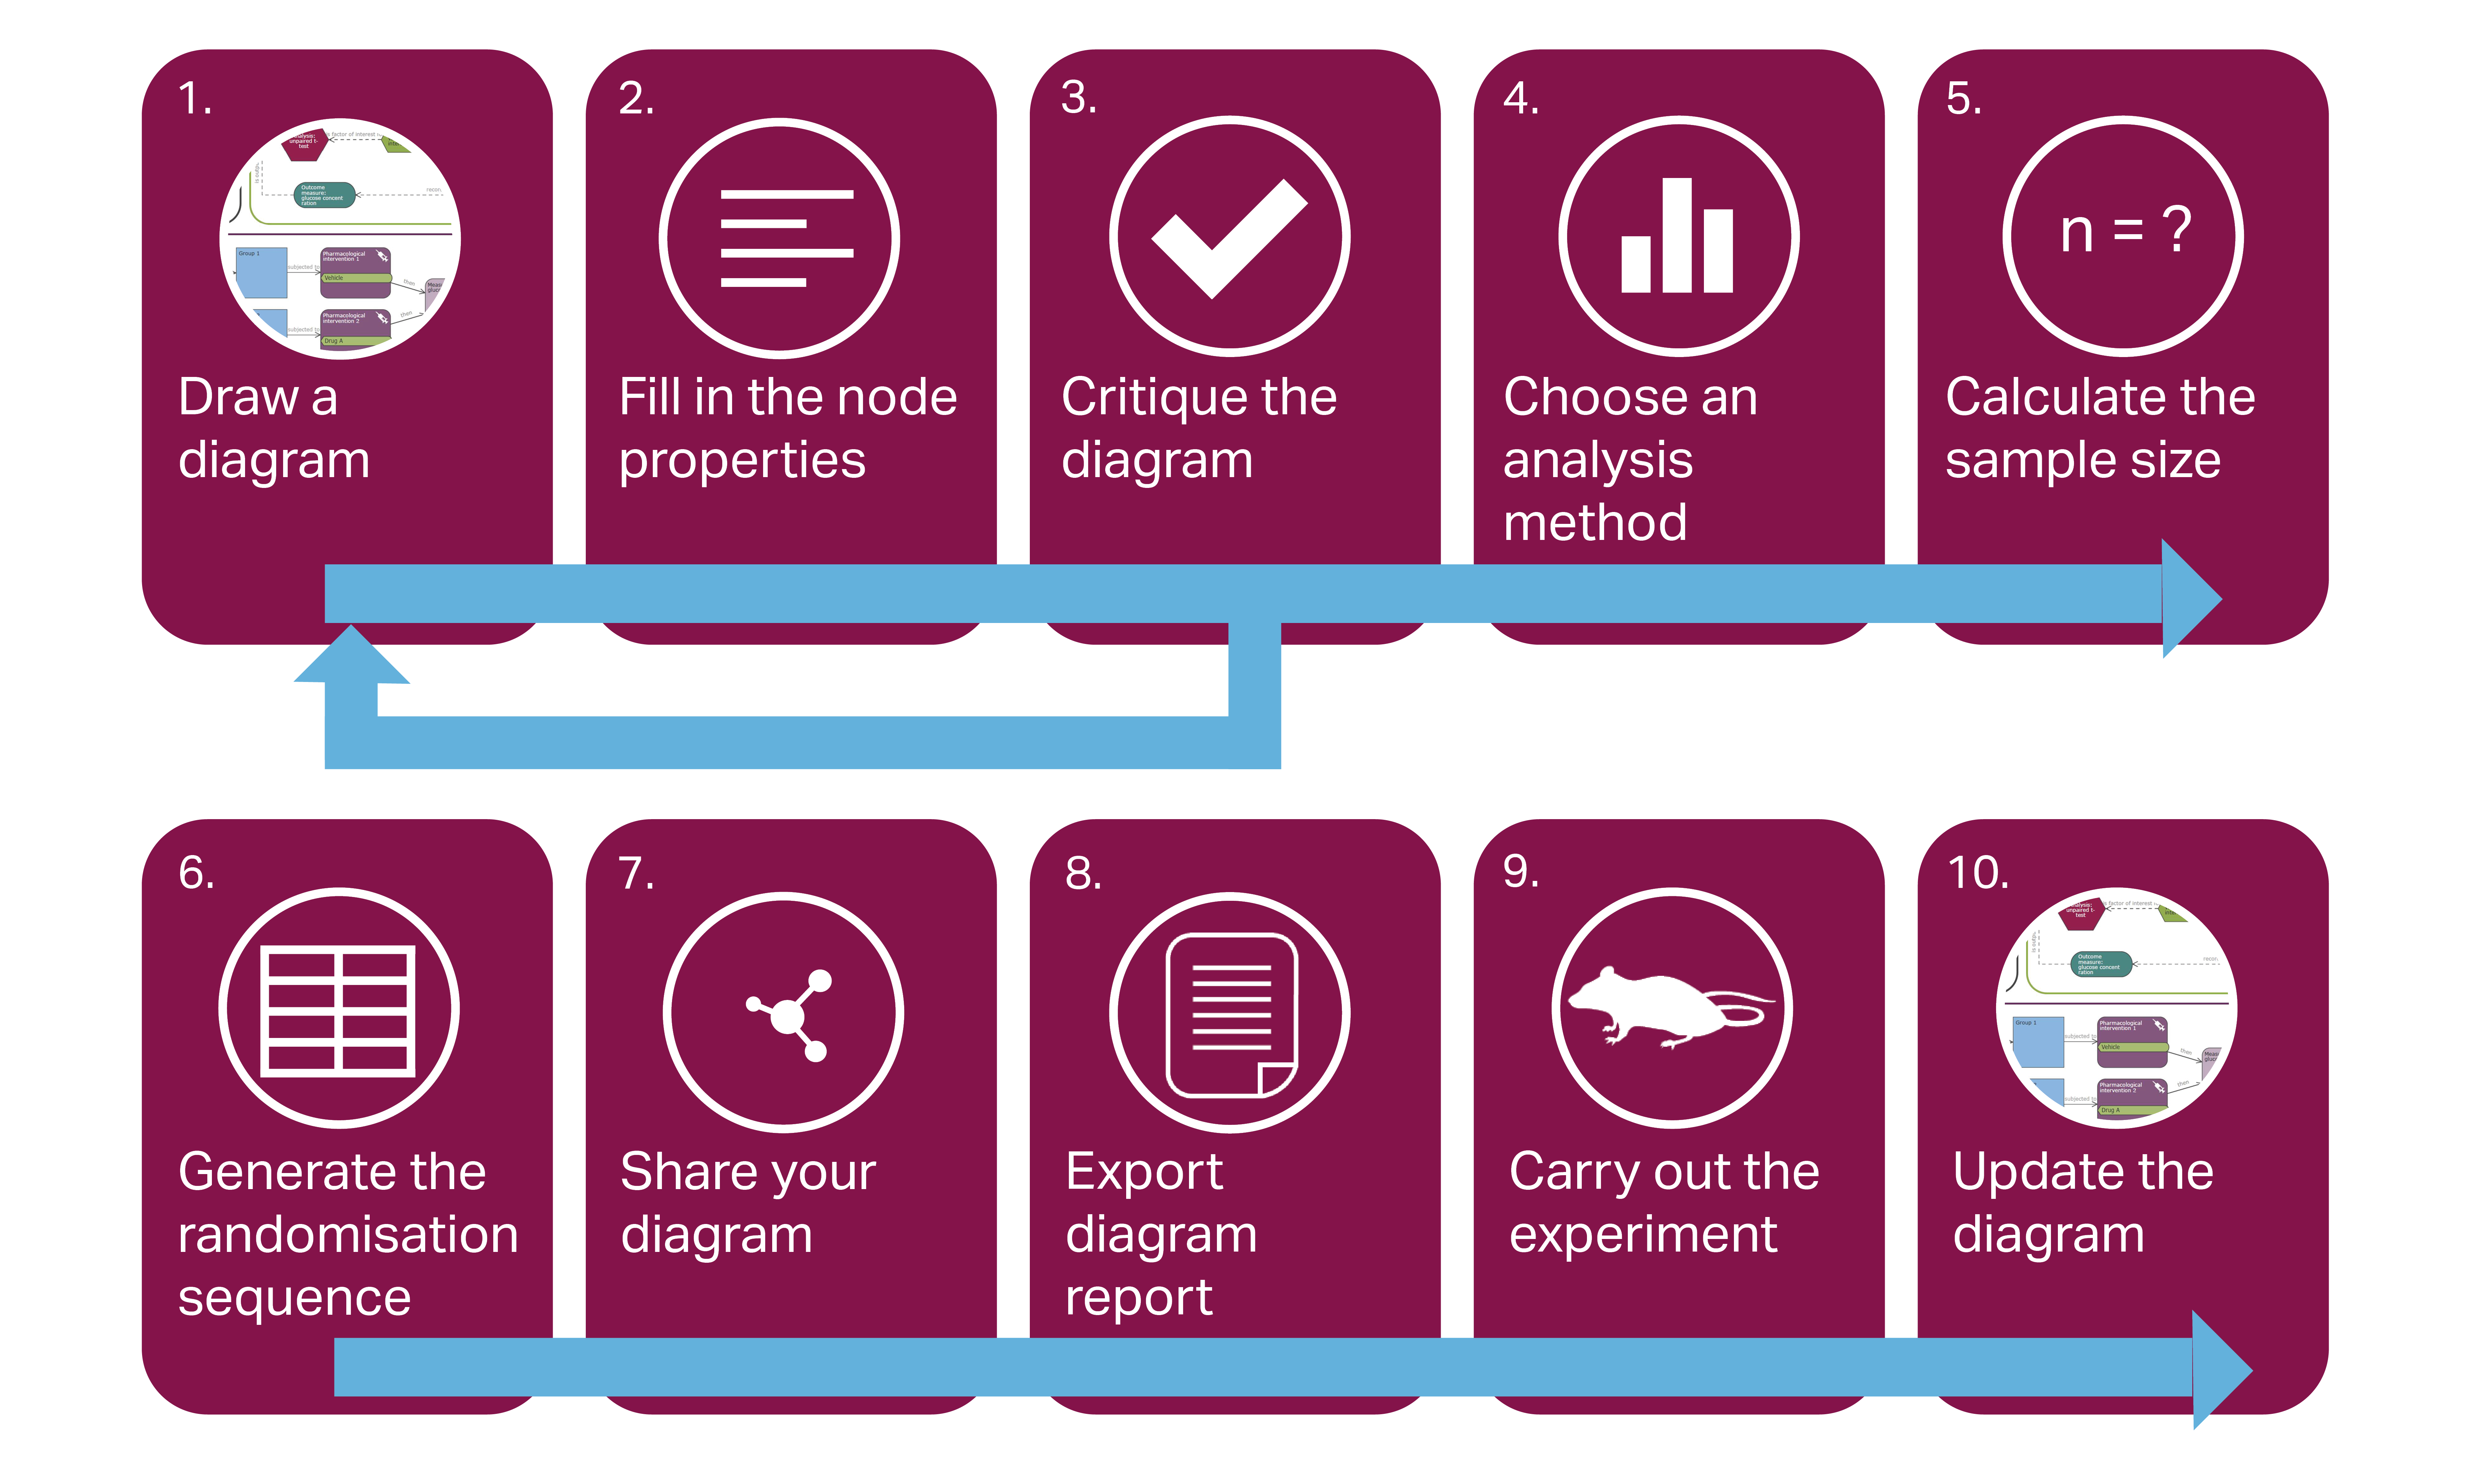
1. Draw a diagram
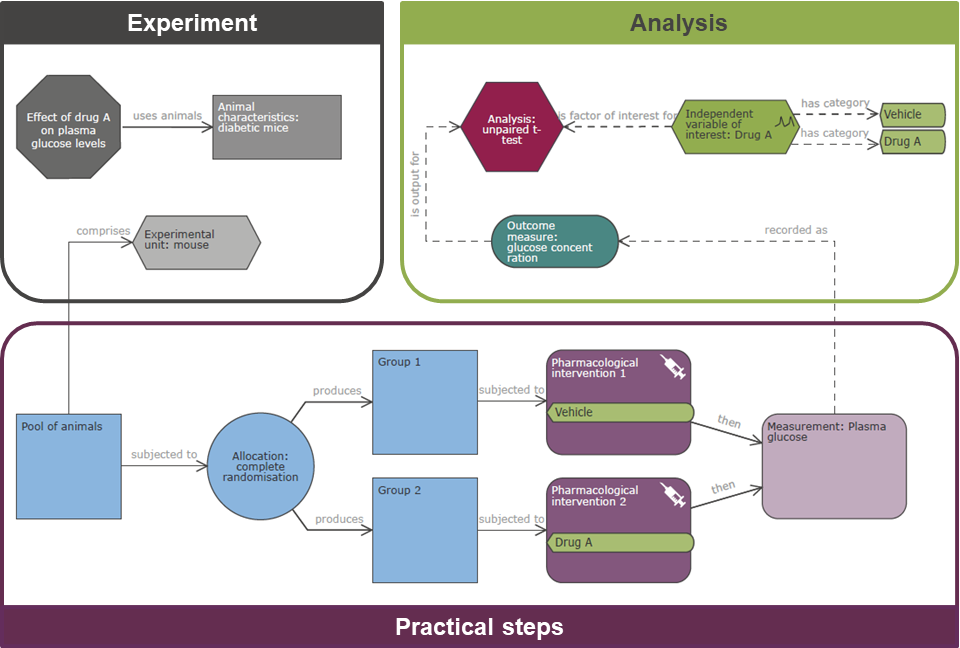
EDA diagrams are made up of coloured shapes called nodes. Each diagram has three parts, each representing different aspects of your design:
- Experiment – provides information about your objective and the characteristics of the animals used.
- Practical steps – represents the main part of your experiment, including the practical steps carried out in the lab.
- Analysis – includes your analysis, data processing and the variables you have included.
You can find general information about EDA diagrams on the 'What is the experiment diagram?' page, and learn how to build a diagram by watching a recorded demonstration. Specific information about each type of node, what they represent and what information to include, can be accessed from the information boxes in the palette when building your diagram.
2. Fill in the node properties 
You can add detailed information about each step in your experiment by editing the properties of each node on your diagram. It is important to add as many details as possible, and some of this information is used by the critique function to give you tailored feedback.
Specific guidance about each node and its properties can be found in the help centre (available from the window where you build your diagram).
3. Critique the diagram  and improve your design
Use the critique function to get bespoke feedback and advice, helping you analyse and review your experimental plan.
The ‘Why use the EDA’ page has more information about the critique function.
Your diagram – and your experimental plan – will evolve based on feedback from the critique function. This is an iterative process and you can repeat steps 1-3 several times to improve your experimental design, as the critique will change as you update your diagram.
4. Choose an analysis method 
Once you have actioned the feedback and included enough information in your diagram, the EDA will suggest statistical tests that are compatible with the design of your experiment.
The 'Why use the EDA?' and 'Analysis' pages have information about choosing an appropriate method of analysis.
5. Calculate the sample size
After choosing a method of analysis you can estimate the required sample size, using the appropriate power calculation. Enter information into the power calculation tabs in the EDA to calculate the sample size needed for your experiment – note this information is only used for the calculation and will not be saved with your diagram. You can then update your diagram with the required number of animals and experimental units needed per group.
For more guidance on sample size see the 'Group and sample size' page.
6. Generate the randomisation sequence 
To help with masking/blinding and randomisation, the EDA can generate a randomisation sequence based on the animal numbers indicated in the properties of each group node.
A randomisation sequence should not be generated until you have finalised your analysis plan, as the method of analysis will have an impact on randomisation (for example, the inclusion of blocking factors). The randomisation sequence should be emailed to the person in charge of coding or administering the treatments so that you (or a selected colleague) can remain unaware of the group allocation during the experiment and data analysis.
For more information about the EDA-generated randomisation sequence see the 'Why use the EDA?' and 'Allocation' pages.
7. Share your diagram 
Share the diagram with your colleagues or collaborators, so that they can review your experimental plan. This can ensure, for example that everyone named in your grant agrees on the experimental plan before the grant application is submitted.
8. Export an EDA report 
There are two ways that you can share your experimental plans with those that do not have an EDA account: a PDF report or a read-only EDA diagram accessed by URL.
Both formats contain key information about the internal validity of your experiment, a summary of the feedback from the system and an image of the EDA diagram itself. The EDA diagram in the read-only version is clickable (this means people with the read-only diagram URL can click on each node to access all the information in your diagram).
The EDA has two export formats to ensure you can always include detailed experimental plans in your grant applications, as part of the ethical review process or when you submit your work for publication, as accepted formats may differ.
For more information about the PDF report and the read-only diagram see the 'Why use the EDA?' page.
9. Carry out the experiment
Once every aspect of the design is finalised the experiment can be carried out. You can refer back to your EDA diagram whilst performing your experiment to ensure you carry out randomisation, blinding/masking and data collection steps as planned.
10. Update the diagram
If applicable you can update your EDA diagram after you have carried out the experiment and collected your data.
For example, if your data does not fit the assumptions associated with the analysis methods you has planned to use then you may have to use an alternative approach. You can update your EDA diagram to add the method of analysis you actually used and the reason for deviating from the plan. Likewise, the number of animals per group might vary from the sample size estimated at the start for a number of reasons. The actual number of experimental units per group can be added to the diagram, with an explanation as to why planned and actual numbers differ.
It is important to update the diagram to reflect these changes so that the EDA is a comprehensive and transparent record of your experiment. This information may be useful when planning future experiments. For example, any difference in planned and actual numbers of experimental units or effect size can be taken into account in the sample size calculations for similar experiments in the future.