Understanding your experiment
How to define hypotheses and set a biologically relevant effect size
- Designing a hypothesis-testing experiment
- Defining your hypotheses
- What is your experiment measuring?
- Looking for a biologically relevant effect
- Using the EDA to plan your experiment
Designing a hypothesis-testing experiment
If you want to study the effect of one or more specific independent variables (e.g. genotype, drug, surgical procedure) on an outcome measure (e.g. blood pressure, bodyweight, time spent in the open in an open field test) using statistical analysis methods, you need to design a hypothesis-testing experiment. By carefully designing your experiment you can determine whether you have evidence to support your hypothesis.
There are many things to consider when you start planning your study, it is helpful to start by identifying:
- The hypothesis you are testing.
- The effect(s) that are of interest for your research question.
- The size of effect that would be biologically relevant (and why).
- The independent variables to include in your study.
- The outcome measures you will assess including which is the primary outcome measure (i.e. the outcome measure that answers your main biological question).
If you are not testing a specific hypothesis using statistics, for example if you are measuring multiple outcome measures and looking for patterns in the data, you will mostly likely be conducting an exploratory study. Exploratory studies can help you decide which variables and outcome measures should be used in future work. Even though specific hypotheses are not tested using statistics, it is still important to identify the effect of interest, independent variables and outcome measures that you will use in the study.
Defining your hypotheses
There are two hypotheses in a hypothesis-testing experiment – null and alternative. If you have multiple sets of null and alternative hypotheses, the main one should be specified.
Null hypothesis (H0)
The null hypothesis, or H0, represents the hypothesis of no change or no effect. In other words, the response being measured is unaffected by the experimental manipulation being tested. For example, if the effect of a proposed anti-cholesterol drug on blood pressure is being tested, then the null hypothesis could be that the drug treatment has no effect on the measured blood pressure:
H0: The anti-cholesterol drug has no effect – there are no differences among treatment and control means.
The null hypothesis cannot be accepted or proven true. In statistics the p-value measures how much evidence there is against the null hypothesis – the smaller the p-value, the more evidence there is against it.
If your p-value is higher than the predefined threshold, this does not mean that the null hypothesis is true (e.g. the drug has no effect on blood pressure). Instead, a high p-value means that there is not enough evidence against the null hypothesis to determine that there is a relationship between the drug and blood pressure (under the conditions in your experiment). This may be because the effect is smaller and/or that the individual variability greater than anticipated.
Alternative hypothesis (H1)
The alternative hypothesis, or H1, represents the hypothesis that there is change or an effect. In other words, manipulating the independent variable of interest has had an effect on the response being measured. For the anti-cholesterol drug example the alternative hypothesis would be:
H1: The anti-cholesterol drug has an effect on blood pressure.
The alternative hypothesis is usually non-directional. For example, it does not state whether the drug causes blood pressure to increase or decrease – this is called a two-sided hypothesis. A non-directional H1 would be tested with a two-sided test, with effects of the drug in any direction taken as evidence against the null hypothesis. This makes H1 different from the experimental hypothesis (i.e. what researchers expect will happen) which is usually directional. It is rare to do an experiment with no idea of which way a significant effect might lie.
The only exception to a non-directional alternative hypothesis is if the laws of physics, or some equally strong a priori evidence, dictate that only results in one direction are valid evidence against the null hypothesis. Using the example above, a directional alternative hypothesis could be:
H1: The anti-cholesterol drug reduces blood pressure.
Directional alternative hypotheses should be used carefully. As a one-sided hypothesis, they imply that data will be analysed with a one-sided test. Results in the opposite direction (e.g. an increase in blood pressure) will be considered as evidence towards the null hypothesis, according to which the treatment has no effect. The fact that a potential treatment actually increases blood pressure is a useful piece of information which few researchers would be willing to discard in drug discovery. One-sided hypothesis also have implications for the sample size calculation.
An example of where a one-sided test could be appropriate is an experiment looking at the survival of homozygous animals in a heterozygous x heterozygous cross. A rate of 0.25 would be expected if the genotype has no effect on the survival of homozygous animals but this rate can only go lower if genotype has an effect. Another example could be a genetic toxicology experiment, where only DNA damage is of interest.
What is your experiment measuring?
The effect of interest is the change in the primary outcome measure you expect to see in response to manipulation of the independent variable(s) of interest.
In the example of an experiment to test the effect of a drug on blood pressure:
- The outcome measure (what you are measuring) could be systolic blood pressure.
- The independent variable of interest could be the drug, with different categories which you are comparing (e.g. vehicle vs. 10 mg/kg).
- The effect of interest could be a change in systolic blood pressure.
Looking for a biologically relevant effect
The effect size is the minimum difference between two groups which would be of interest biologically. It is not based on prior knowledge of the magnitude of the treatment effect. You should always have an idea of the minimum difference you want your experiment to detect. For example, the minimum effect which would be worth taking forward into further work or clinical trials.
The effect size is one of the parameters used in the power analysis to estimate the sample size. Careful consideration of the effect size means you can power your experiment to detect only meaningful effects and not generate statistically significant results that are not biologically relevant. It is important in grant and ethical review applications to explain how you chose the effect size and why it is of biological interest or clinical relevance.
For the anti-cholesterol drug example, the researchers would only be interested in any change greater than the existing gold-standard therapy as new therapies must at least match this effect. The best anti-cholesterol drug available might reduce blood pressure by 20mmHg, meaning the effect size for their experiment would be 20mmHg and only drugs that have an effect greater than 20mmHg would be worth taking forward into further research.
Using the EDA to plan your experiment
The EDA was developed to help scientists design robust experiments using animals. You can use what you have learned on this page to describe the objectives of your experiment in the EDA’s experiment node.
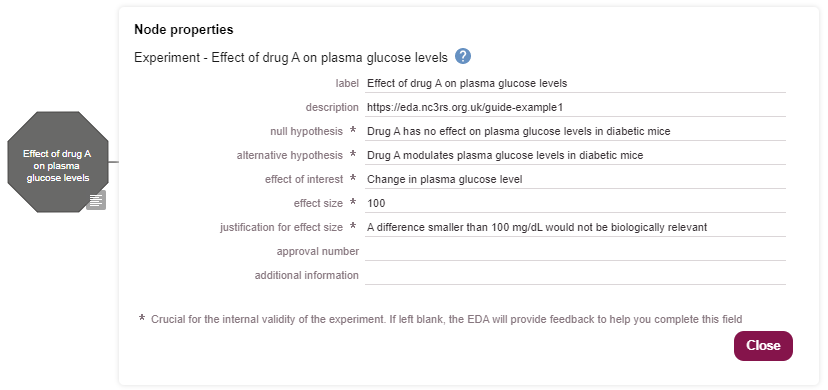
If you are designing a hypothesis-testing experiment you can specify both the null and alternative hypotheses. There are also fields for the effect of interest, the biologically meaningful effect size (including room to explain why an effect of this size is of interest) and a brief description of the experiment. Defining these parameters before you start will help to ensure your design is robust, your experiment is reliable your data is and meaningful.
References
Drummond, GB and Tom, BD (2011). Presenting data: can you follow a recipe? J Physiol 589(21):5007-5011. doi: 10.1113/jphysiol.2011.221093
Festing, MF and Altman, DG (2002). Guidelines for the design and statistical analysis of experiments using laboratory animals. ILAR J 43(4):244-58. doi: 10.1093/ilar.43.4.244
Johnson, PD and Besselsen, DG (2002). Practical aspects of experimental design in animal research. ILAR J 43(4):202-6. doi: 10.1093/ilar.43.4.202
Smith, CJ and Fox, ZV (2010). The use and abuse of hypothesis tests: how to present P values. Phlebology 25(3):107-12. doi: 10.1258/phleb.2010.009094
McDonald, JH (2015). Basic concepts of hypothesis testing. [accessed on 28 September 2023]