What is the experiment diagram?
The EDA enables you to represent your experiment as a diagram, which can be a lot more explicit than a text description of your experimental plan. Each step of the process can be represented visually and a great level of detail can be provided on each step.
Contents
What does an EDA diagram look like?
The annotated diagram below is an overview of an EDA diagram. The annotations provide a summary of the different node types (the coloured shapes in the image below), and their purpose in the diagram. Click here to download a larger version of this image.
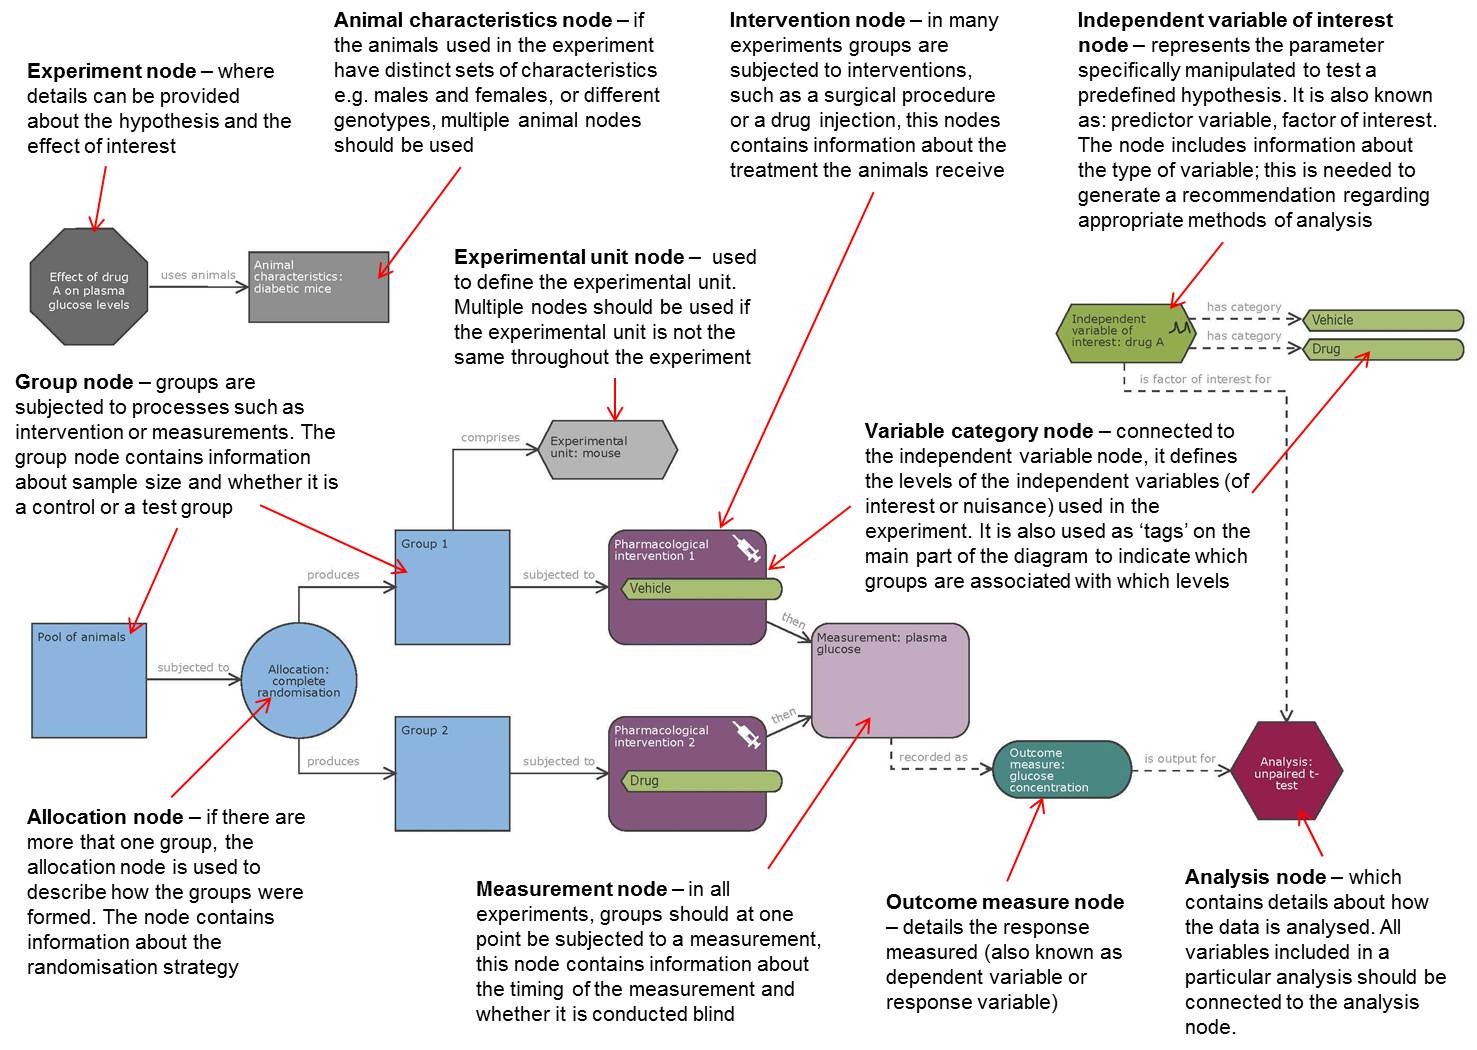
The above diagram is based on a two group comparison experiment. More templates and examples, illustrating different experimental design features, can be found on the templates page, once you have logged in to the EDA.
Nodes and links
Diagrams are constructed with coloured shapes called nodes which are connected by arrows called links. Nodes represent the basic components of an experiment, and there are several different types of node.
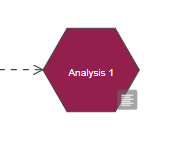
The image above is an example of an analysis node. You can enter more information about each node in the properties of that node.
Links represent the relationship between connected nodes and there are several different types of link. The link type used to connect nodes is selected by the EDA based on the types of nodes being connected.
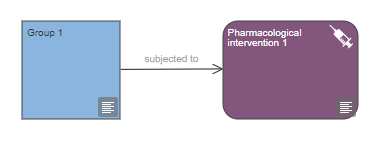
Links are displayed as a solid line (see image above) when they represent a physical process, such as performing an intervention.
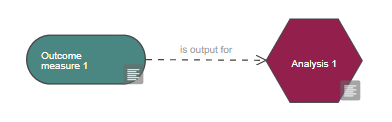
Links are displayed as a dashed line (see image above) when they represent data processing.
An EDA diagram has three main parts, each representing different aspects of the experimental design:
- High level experiment information – these nodes contain information about the objectives of the experiment and the characteristics of the animals used
- Practical steps – these nodes represent the practical steps carried out in the lab
- Analysis information – these nodes include details of the analysis plan, data processing and variables
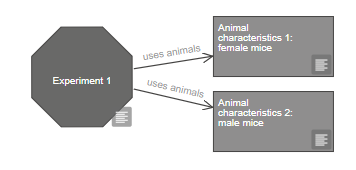
High level experiment information
This part of the diagram should have one experiment node linked to at least one animal characteristics node. The experiment node includes information about your objectives. The animal characteristics node contains details about the animals used in the experiment.
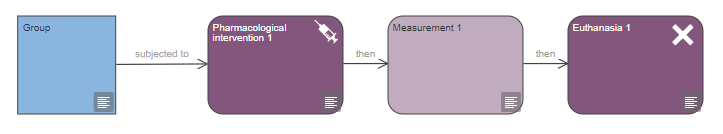
Practical steps
This part of the diagram represents physical processes in the laboratory, for example taking a measurement or performing an intervention.
In the example below a group of animals is subjected to an intervention, a measurement is then taken, after which the animals are euthanised.
Analysis information
This part of the diagram represents your plan for processing the data you collect in your experiment. Your diagram should always include an outcome measure node (the outcome measure is also known as the dependent or response variable), an independent variable of interest node (this is also known as the manipulated or predictor variable) and one analysis node.
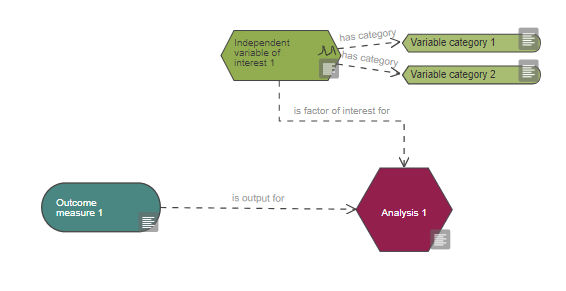
If your data needs to be transformed before analysis, you can add a data transformation node (circled in red in the image below).
![]()
Other sources of variability can also be incorporated in the design, with the node: ‘nuisance variable’ which can be connected to the analysis node with the links ‘is blocking factor for’, 'is covariate for' or 'causes variation to', depending on if and how the variability is accounted for.
![]()
Back to top
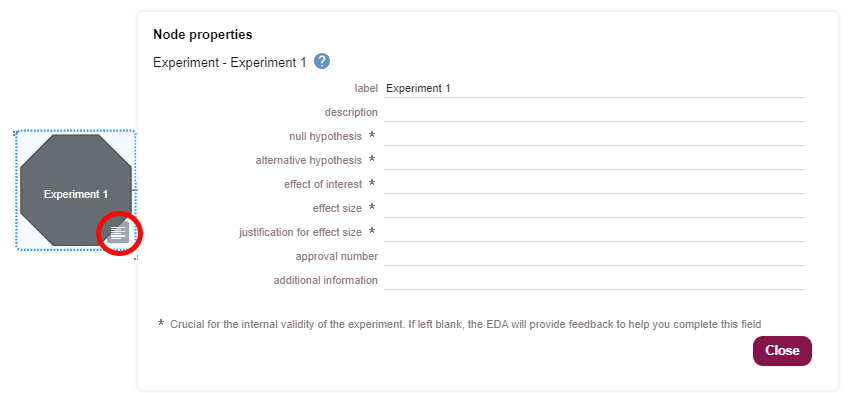
Node properties
Each node has properties where specific details can be provided. All nodes, and the information provided in their properties, are described in more detail in the experimental design section.
The image below shows the properties of the experiment node. For each node, the properties can be accessed via the icon circled in red in the image below.