Measurement
Key considerations for deciding what to measure in an in vivo experiment and selecting the primary outcome measure.
- How experimental design affects measurements
- Outcome measure
- Data transformation
- Representing measurements and outcome measures in the EDA
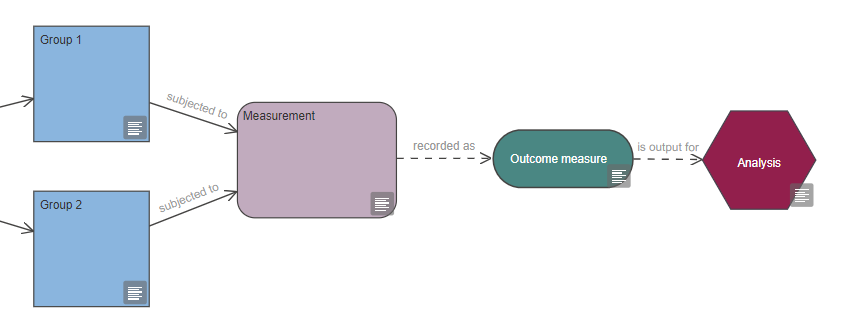
A measurement is a process which a group of animals (or experimental units) is subjected to, in order to collect data; it is recorded as at least one outcome measure.
How experimental design affects measurements
All experiments involve measurement of some kind, with the outcome measure (also known as the dependent variable) then used in the analysis.
The timings of your measurements can affect results, including:
- The time of the day you take the measurement.
- The time relative to the start of the experiment or to a specific intervention.
- The length of time each measurement takes (if it is relevant).
- How often you take measurements (for a repeat measurement).
If possible, you should be blinded (aka masked/not be aware of the group allocation) when making measurements and the order in which animals (or experimental units) are measured should be randomised.
You can keep the group allocation concealed during result assessment with the help of a colleague who can code the animals (or the units of measurement) so that you do not know what treatment animals have received or what group they belong to. Your colleague can also randomise the order of the codes to indicate the order in which you should take measurements. This randomised order ensures that you are not measuring all animals from one group first before measuring all animals from another. Alternatively, you can code the animals, randomise the order of the codes and let a colleague take the measurements.
If you are aware of the group allocation while measuring the outcome, you should explicitly state that you were not blinded, along with the reason why blinding was not possible, when publishing and disseminating your research. A justification for carrying out measurement unblinded could be for example, if animals in different treatment groups had different coat colours. If blinding is not possible at the measurement stage, randomising the order in which measurements are taken still reduces bias. Additionally, it is especially important to ensure that subjective bias is reduced at other stages of the experiment (e.g. with allocation concealment and blinded analysis of the data).
Outcome measure
The data you collect from measurements in an experiment are outcome measures – also known as dependent variables. A measurement can be recorded as more than one outcome measure. For example, if activity is measured, one outcome measure could be the time spent walking and the other the distance travelled.
Continuous or categorical outcome measure
Outcome measures can be categorical or continuous, and the type of data collected has implications for the data analysis methods that can be used.
Continuous data are sometimes referred to as quantitative data and are measured on a numerical scale. Continuous measures include truly continuous data but also discrete data. Examples of true continuous data include bodyweight, body temperature, blood/CSF concentration or time to event, while examples of discrete data include litter size, number of correct response or clinical score.
Categorical responses are measured on a non-numerical scale; they can be ordinal (e.g. severity score: mild/moderate/severe), nominal (e.g. animal’s reaction: left/middle/right arm maze) or binary (e.g. disease state: present/absent).
Continuous responses may take longer to measure but they contain more information. If possible, measure a continuous rather than categorical response. Continuous data can also be analysed using the parametric analyses, which have higher power – this reduces the sample size needed.
Outcome measure variability and sample size
You should identify the primary outcome measure when planning your experiment. It is the outcome of greatest importance, which will answer your main experimental question. The number of animals needed in your experiment is determined by the power needed to detect a difference in the primary outcome measure.
The anticipated standard deviation of the primary outcome measure is used to estimate the sample size you need for your experiment, based on a power calculation.
Data transformation
You may choose to transform your outcome measure (i.e. the data from your experiment). Two common ways are by using summary measures or normalisation.
Summary measures
If you are measuring animals (or experimental units) repeatedly – for example taking measurements at several time points or from several brain regions – you can use summary measures in the analysis.
Summary measures simplifies the analysis as it reduces the number of factors of interest. Examples include area-under-curve (AUC), Tmax, Cmax, ED50, average per animal or percentage of baseline.
Transformation to normalise the data
If the response (or more precisely the residuals from the analysis) are not normally distributed – whether this is anticipated at the planning stage or detected once the data are collected – it can usually be normalised to enable the use of parametric tests.
Representing measurements and outcome measures in the EDA
The EDA has three different types of nodes to represent data collection. The measurement and repeated measurement nodes are used to describe the process of making the measurements. These nodes must be used in conjunction with an outcome measure node, which is used to describe the data collected. Additional pre-analysis processing is indicated with a data transformation node.
Every experiment diagram should feature a measurement node, as all groups should at one point be subjected to a measurement which is recorded as one or several outcome measures. The outcome measure (dependent variable) is then used as the output for your analysis.
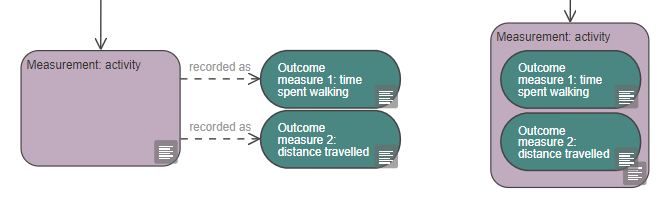
A measurement can be recorded as more than one outcome measure. For example, if activity is measured, one outcome measure could be the time spent walking and the other the distance travelled. Each can be fully defined in the properties of their respective outcome measure nodes.
The measurement and outcome measure nodes can either be connected with a ‘recorded as’ link or, to simplify the diagram, a measurement node can be ‘tagged’ with outcome measures nodes, as shown below in the image on the right.
Representing time as a variable in the EDA
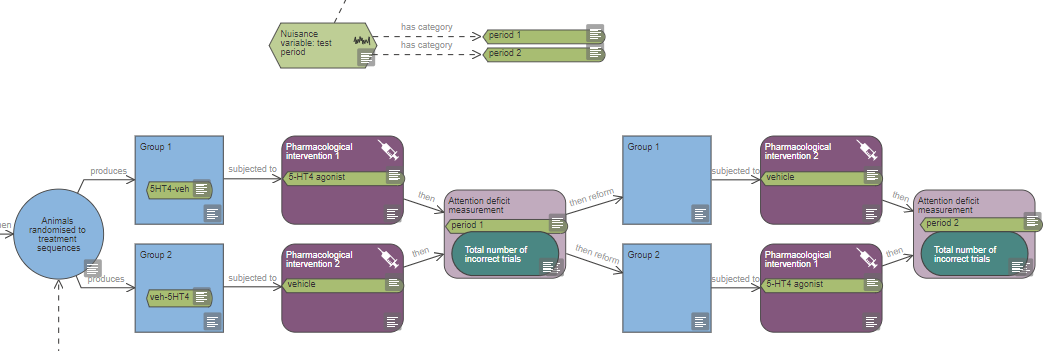
If time is a variable in your experiment (either a nuisance variable or a variable of interest), measurement nodes should be tagged with the appropriate variable categories. For example in Example 2 (see image below), the test period is a nuisance variable and measurement nodes are tagged with the categories ‘period 1’ and ‘period 2’.
The measurement node refers to a single measurement. If the same measurement is repeated multiple times consecutively, for example over several days, and the animals are not subjected to any other intervention during that period, a repeated measurement node can be used to simplify the diagram (see the image from Example 3 below).
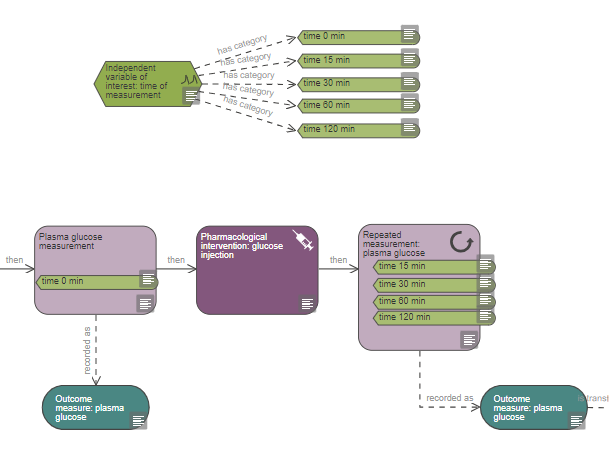
The number of times this measurement is repeated should be indicated in the properties of the repeated measurement node. If time is an independent variable in the experiment, the repeated measurement node should be tagged with all the variable categories nodes of all time points represented by the repeated measurement node, as shown in Example 3 and the image below.
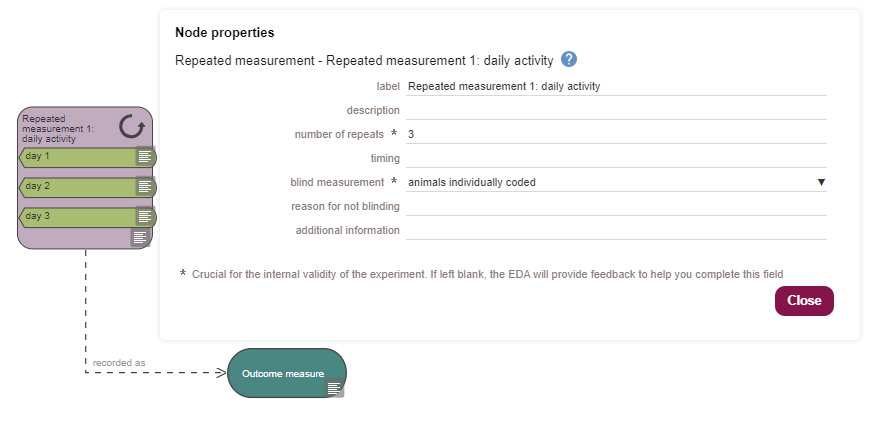
You can provide additional information in the properties of either type of measurement node.
Representing data transformation in the EDA
If you plan to transform your outcome measure, use a data transformation node. Data transformation nodes are outcome-specific – two different outcome measures cannot be connected to the same data transformation node even if both outcomes are transformed the same way. The data transformation produces the output which is used in the analysis.
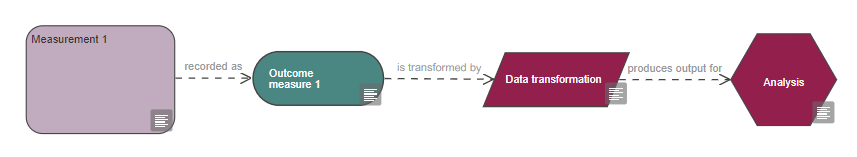
You can indicate either of two different types of transformation in the data transformation node: summary measures and transformation to normalise the data. In the properties of the data transformation node, you can indicate whether the outcome measure is expressed as the raw values or as a summary measure. If you do not have a data transformation node, it is assumed that raw values will be used in the analysis.
References
Bate, ST and Clark, RA (2014). The Design and Statistical Analysis of Animal Experiments. Cambridge University Press.