Read-only diagram
This help topic covers:
- What is a read-only diagram?
- What can a read-only diagram be used for?
- How do I create a read-only diagram?
What is a read-only diagram?
A read-only diagram is a static copy of an EDA diagram, including a table containing key experimental design information as well as the diagram itself. A read-only diagram can be created from within the EDA editor window, and can then be accessed via an unguessable URL. For security reasons the read-only diagram is created with an access code with you can choose to turn off*. The diagram can be shared with others by sending the URL and access code. Recipients do not need an EDA account to access the read-only diagram.
The table included in the read-only diagram contains the key experimental design information that is requested by most funders during grant applications: objectives and hypotheses, animal numbers and justification for the sample size, details of steps taken to reduce bias (such as randomisation and blinding), and the statistical analysis plan. In addition, clicking on any node in the read-only diagram opens the properties for that node.
*Removing the access code enables web scrapers to collect information from your diagram as they index web pages for search engines. We recommend leaving the access code in place until you are ready to publicly share your experiments (e.g. when you publish your study).
What can a read-only diagram be used for?
A read-only diagram allows you to share detailed information about the design of an experiment. The link to a read-only diagram can be included in grant applications, ethical review submissions or scientific manuscripts. It can also be a useful way of sharing information with scientific collaborators, within or between laboratories.
If links cannot be used, the table of key experimental design information can be shared by creating an Experimental Design Report and sharing the PDF instead.
How do I create a read-only diagram?
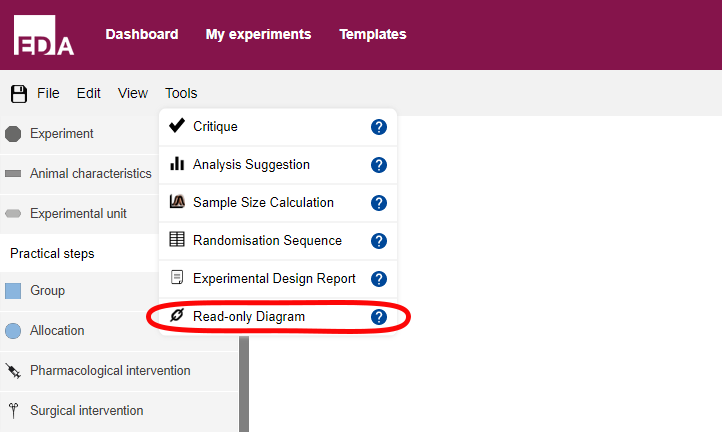
- Either go to the Tools menu and click on Read-only diagram OR go to the File menu and click on Export and then Read-only diagram. At this point you will be required to save your diagram to continue.
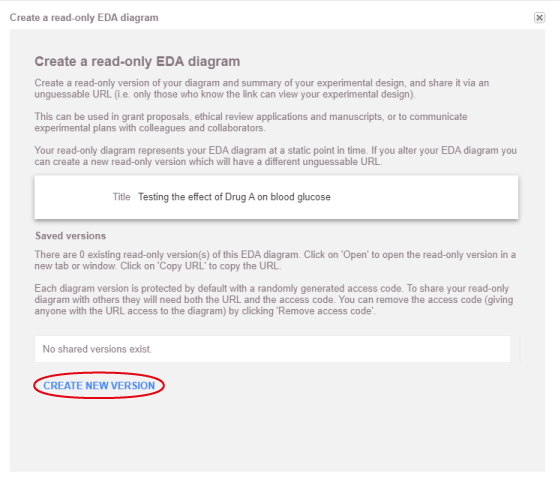
- In the pop-up window click 'create new version'. If your experiment had a complex design, it may take a few minutes to generate the read-only diagram.
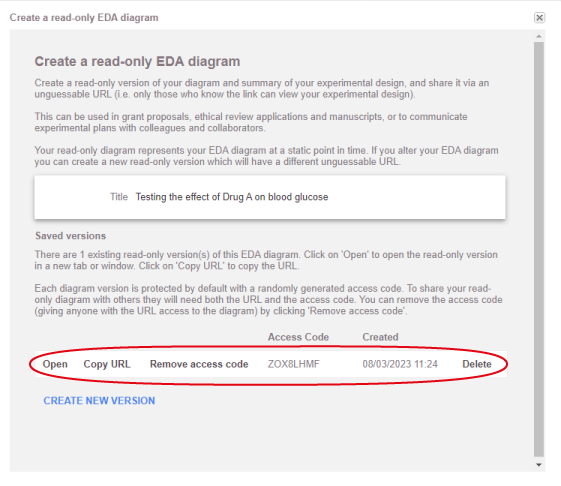
- Once the read-only diagram has been created it will appear in the 'saved versions' list at the bottom of the pop-up window. The read-only diagram has an access code by default, this allows you to control who sees your experimental plans as recipients will need both the URL and access code to access your diagram. You can remove the access code by clicking 'Remove access code' but be aware that this will make the diagram freely and publicly available to anyone with the URL (and search engines). We recommend leaving the access code in place until you are ready to publicly share your experiments (e.g. when you publish your study).
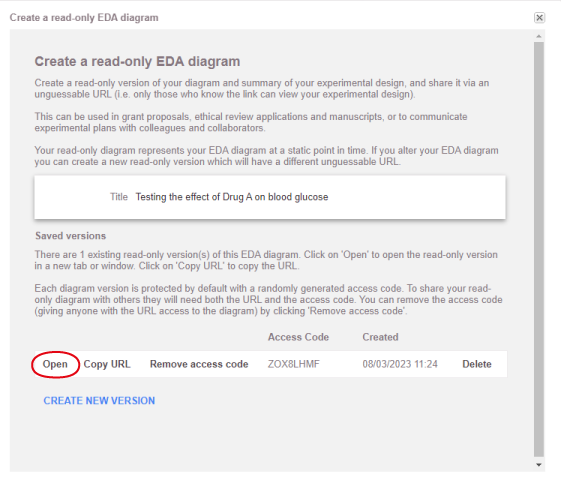
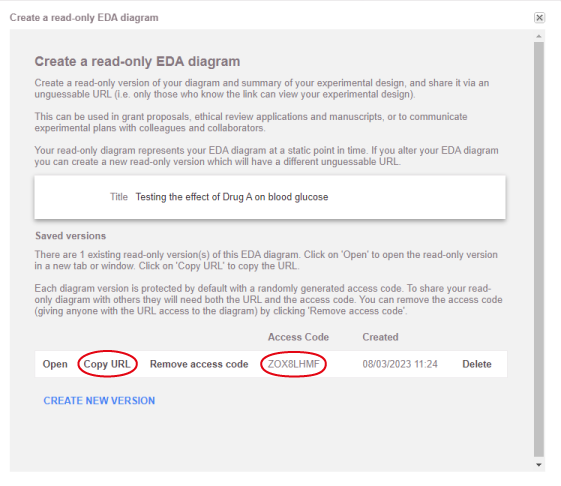
- Click 'Open' to open the static representation of your experiment in a new browser tab (circled in red in the image below).
- To share your read-only diagram with others click 'Copy URL' to copy the URL, then paste this into an email or document. Next select the text of the access code and paste this into your email or document as well. Both are circled in red in the image below.
Note: Once created, a read-only diagram will not be automatically updated to reflect any changes to your EDA diagram. If you change your EDA diagram, you can create a new read-only diagram by following steps 1 - 4.